NLP-Project: How I got Involved
01 Jan 2015My NLP-Project
The index housing all the pages for my NLP-Project is found here: Building a Word Predictor
If you've just landed on this page and are looking for the word prediction shiny app I made for the Capstone Project, you can find that here A ShinyApp Word Predictor.
How I got involved with NLP
Over the past two months [Nov. 2014 - Dec 2014] the first full run of the Data Science Specialisation Capstone Project, over at Coursera (with Johns Hopkins), took place.
As of this post (Jan. 1st 2015) the last message from the instructors before the holidays states in the opening paragraph that there were over 800 people taking the final project.
After taking the 9 previous coursers in the Specialisation I was one of the 800 who took the Capstone project.
My experience with the Coursera Data Science Specialisation
The data science specialisation found at coursera.org deserves a post of its own. Finding the time to put together that post is on my list of things to do. In brief however, it's an excellent series of courses that gets you familiar with R programming, statistics, and the tasks involved when working with data.
It isn't a one stop shop for anyone that wants to get to grips with data and for some there are places where the mathematics is a little steeper than they might be used to. All in all, for someone like me which is comfortable with scientific computing, playing with data, has taken and taught courses in Statistics and has a strong background in mathematics; the specialisation has been enjoyable, at times challenging and a pursuit that I've thoroughly enjoyed. If you're thinking about taking the course, just go for it.
The Captsone Project
The final course in the specialisation is a Capstone project. All we (the participants) knew before the project got underway was that this project would be in association with SwiftKey.
From the wiki page, SwiftKey was founded in 2008 and is an input method for Android and iOS and more importantly for the capstone project "SwiftKey uses a blend of artificial intelligence technologies that enable it to predict the next word the user intends to type."
The tasks
The capstone project was split into 8-tasks (these served as a means of keeping in touch with the suggested deadlines). These were
- Understanding the Problem
- Data Acquisition
- Exploratory Analysis
- Modelling
- Prediction
- Creative Exploration
- Data Product
- Slide Deck
Each of these tasks had a short video (between 1-2 minutes) prompting the user to think about a particular aspect associated with the task at hand. Personally I didn't find these videos terribly enlightening nor do I think they were supposed to be, the idea it seems (in hindsight) was to give the participants freedom to explore topics concerning NLP on their own and decide what they wanted to try themselves.
Quizzes [25%]
| Quiz | Title | Worth | Due Date | Num Attempts Allowed | Num Questions | Marking | Description |
|---|---|---|---|---|---|---|---|
| 1 | Getting Started | 5% | 10-Nov-2014 | 2 | 6 | Auto | Concerned the raw text files, word counts and the use of grep |
| 2 | Natural Language Processing I | 10% | 17-Nov-2014 | 2 | 10 | Auto | "For each of the sentence fragments below use your natural language processing algorithm to predict the next word in the sentence." |
| 3 | Natural Language Processing II | 10% | 24-Nov-2014 | 2 | 10 | Auto | This was a much more involved version of quiz 2. |
Both quiz 1 and 2 involved working with the raw data. A modest amount of grep knowledge would have sufficed to do well on both quizzes.
The third quiz however was different. It was really a significant step up, requiring a somewhat decent prediction algorithm and involving a number of very difficult test cases.
The idea seemed to have been to show the limitations of a basic "grep/Ngram" approach - and it certainly did that! The general consensus (from the board activity) seemed to suggest that this quiz came too early. Most participants had only begun testing their first "proper" prediction alorithm and hadn't looked at different prediction alorithms. Still, it was good to see how much poorly a "good-for-quiz-2-algorithm" did in quiz 3.
Sample from Quiz 1:
Q: What is the length of the longest line seen in any of the three en_US data sets?
| Option 1 | Option 2 | Option 3 | Option 4 |
|---|---|---|---|
| Over 40 thousand in the news data set | Over 40 thousand in the blogs data set | Over 11 thousand in the blogs data set | Over 11 thousand in the news data set |
Sample from Quiz 2:
Q: The guy in front of me just bought a pound of bacon, a bouquet, and a case of [BLANK]
| Option 1 | Option 2 | Option 3 | Option 4 |
|---|---|---|---|
| beer | pretzels | soda | cheese |
Sample from Quiz 3: (Note: Arctic Monkeys was all lower case)
Q: I'd give anything to see arctic monkeys this [BLANK]
| Option 1 | Option 2 | Option 3 | Option 4 |
|---|---|---|---|
| decade | morning | weekend | month |
A milestone report [20%]
| Title | Worth | Due Date | Num Attempts Allowed | Num Questions | Marking | Description |
|---|---|---|---|---|---|---|
| A milestone report on exploratory analysis of the data set | 20% | 16-Nov-2014 | 1 | N/A | Peer | A short report for a nondata scientist manager outlining major features, published on RPubs. |
Note: This report was due in at the same time as Quiz 2.
To quote the Milstone Report Ruberic's Preamble
The motivation for this project is to:
- Demonstrate that you've downloaded the data and have successfully loaded it in.
- Create a basic report of summary statistics about the data sets.
- Report any interesting findings that you amassed so far.
- Get feedback on your plans for creating a prediction algorithm and Shiny app.
I've chosen to omit the actual final marking scheme and details as I don't think it is really in keeping with the honour code or my place to give away too many specific details about the Capstone (incase they run with the same project in the future).
My own milstone report can be found at rpubs.com/Sepanda/MilestoneReport
The executive summary :
This is a progress report concerning the task of producing a word prediction app.
English text files taken from blogs, news articles and tweets are briefly examined within this report.
The current findings are:
- Cleaning the data of characters which do not contribute to word prediction is both important and challenging.
- The three sources; blogs, news, and twitter, show variety in the number of unique words used and variety and the ranking (in order of frequency) that terms are used.
- A prediction algorithm based on the final 2, 3 and 4 words of a sentence is in development.
- In order to produce a web ready app a considerable amount of time will be spent reducing the resulting prediction tables without loosing a large amount of accuracy in prediction.
Highlights of the report:
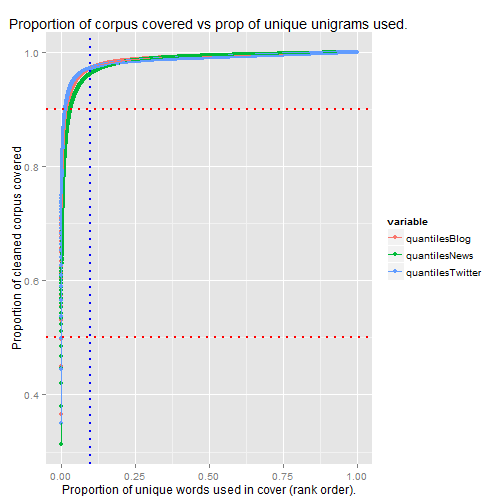
The plot above shows that over 90% of the words (upper horizontal red line) identified by the algorithm are covered by less than 10% (vertical blue line) of the the most frequently occurring unique words.
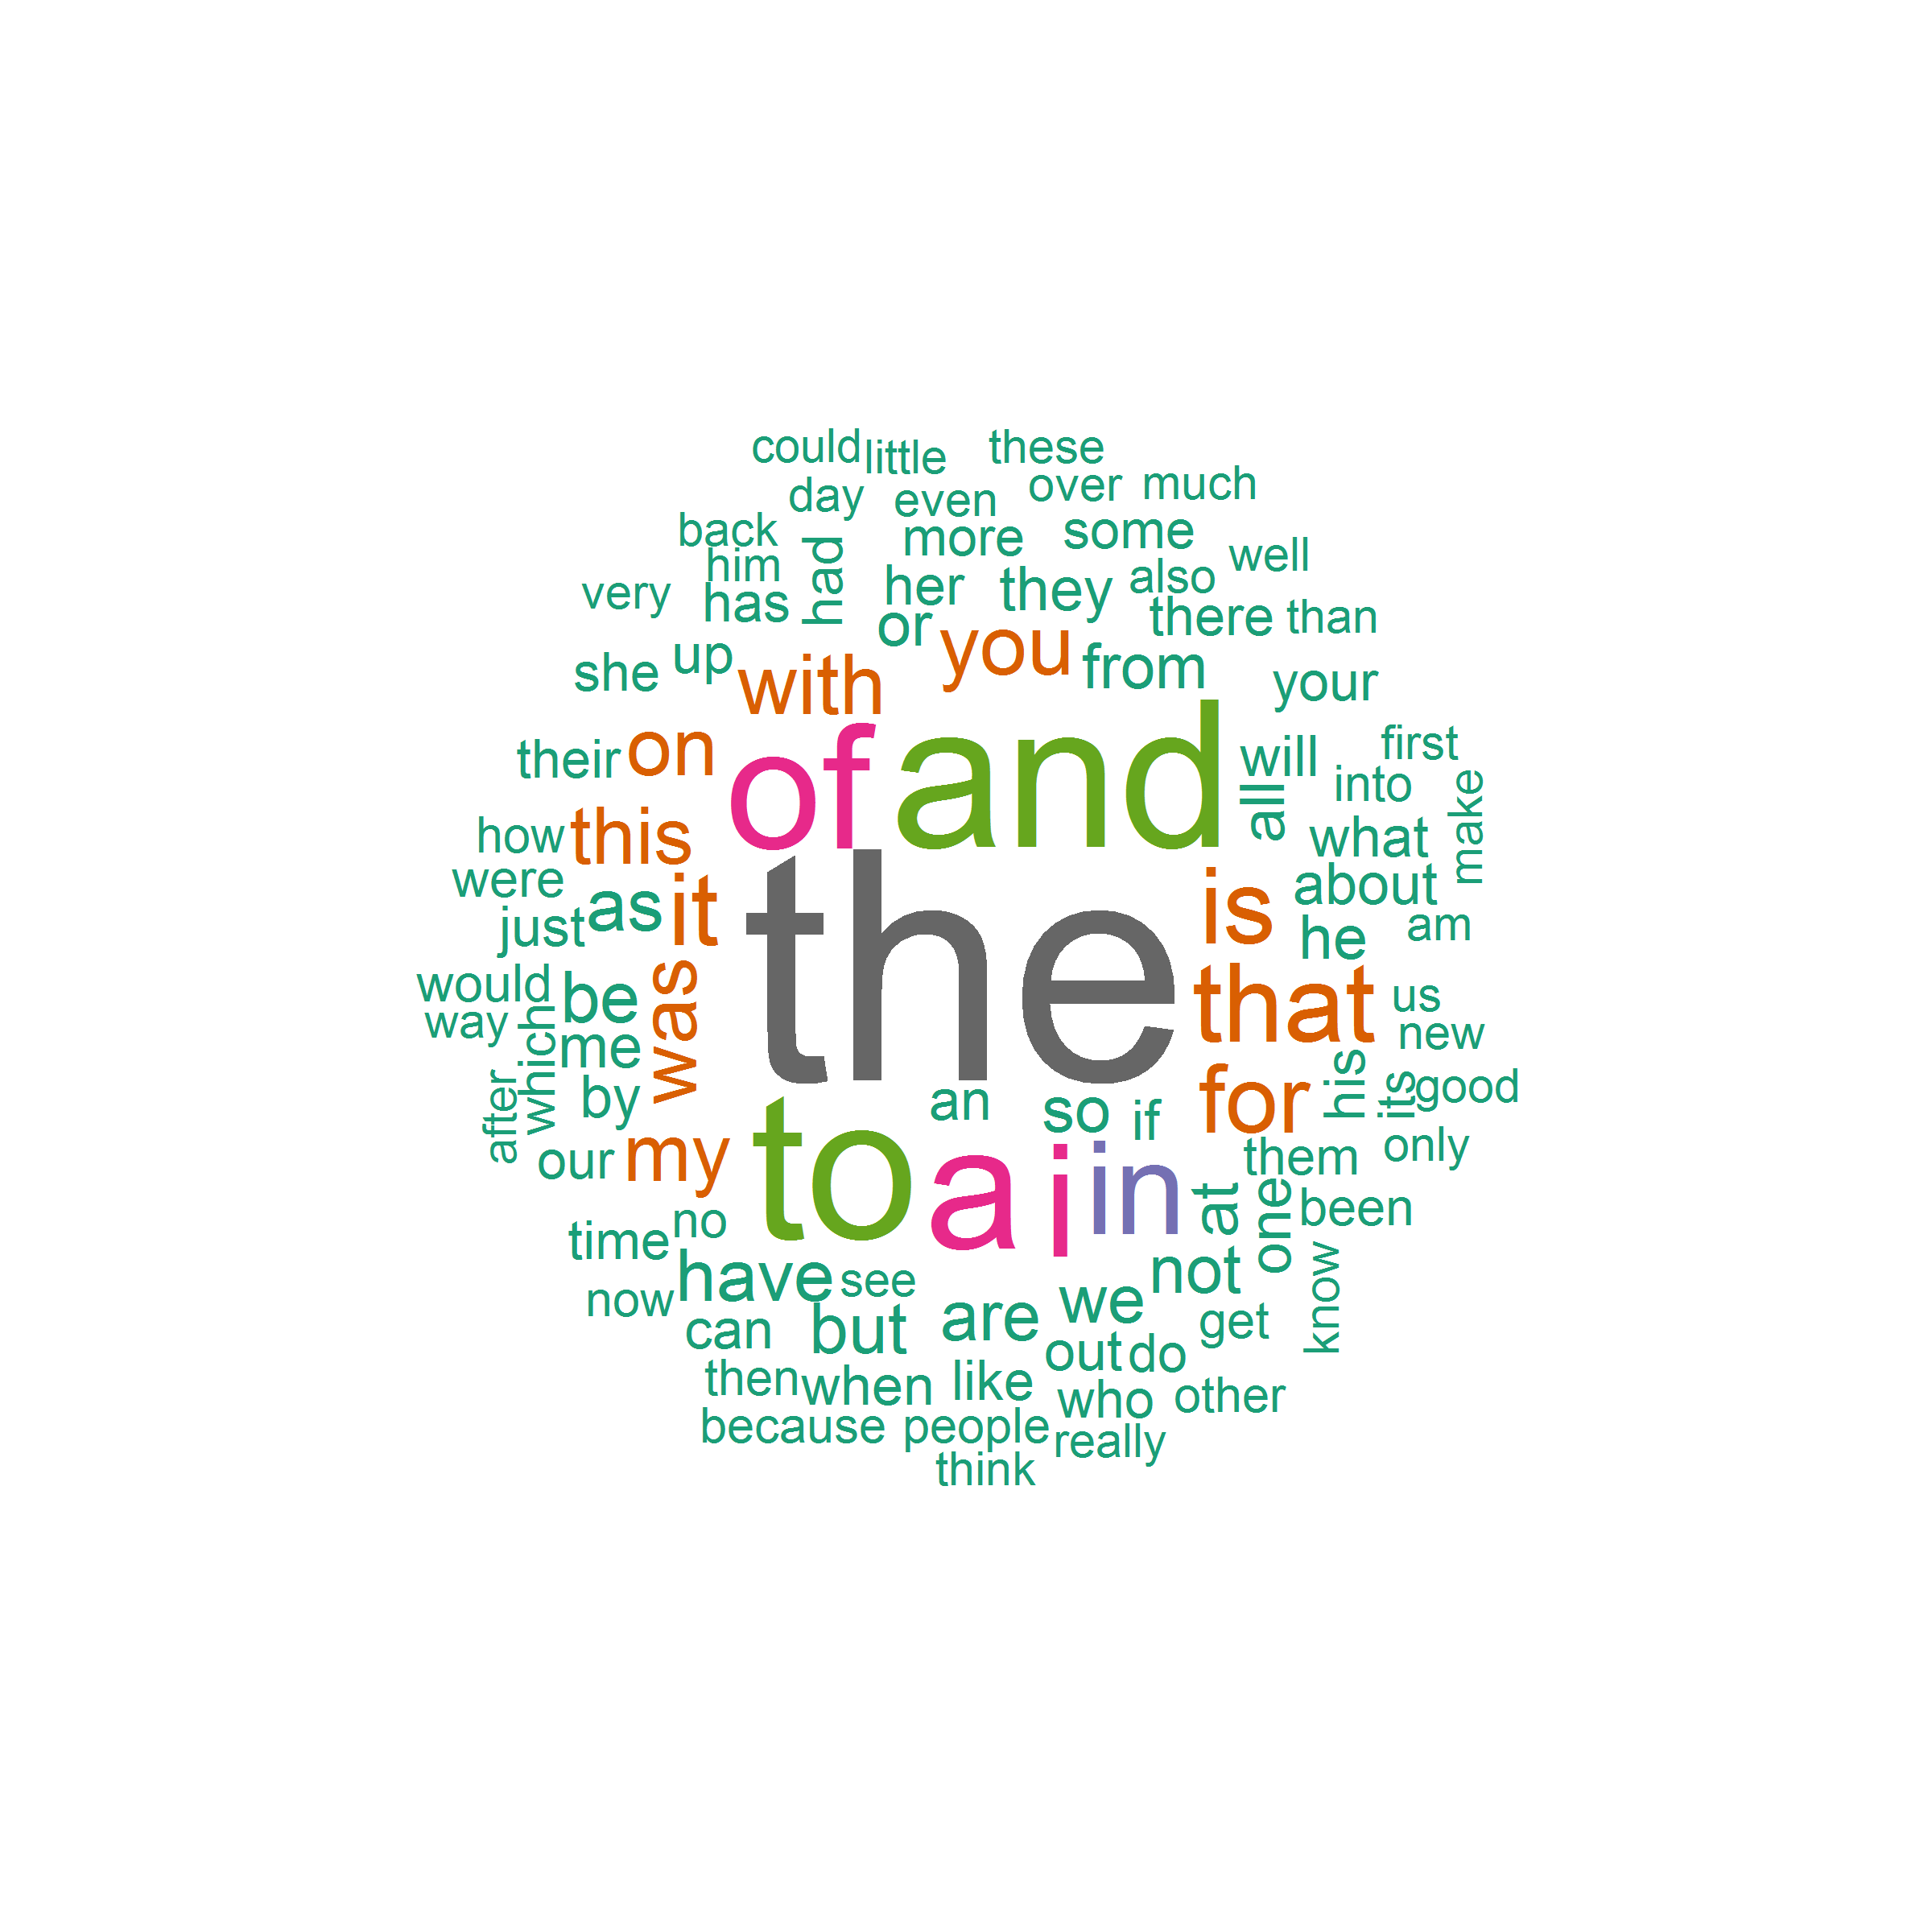
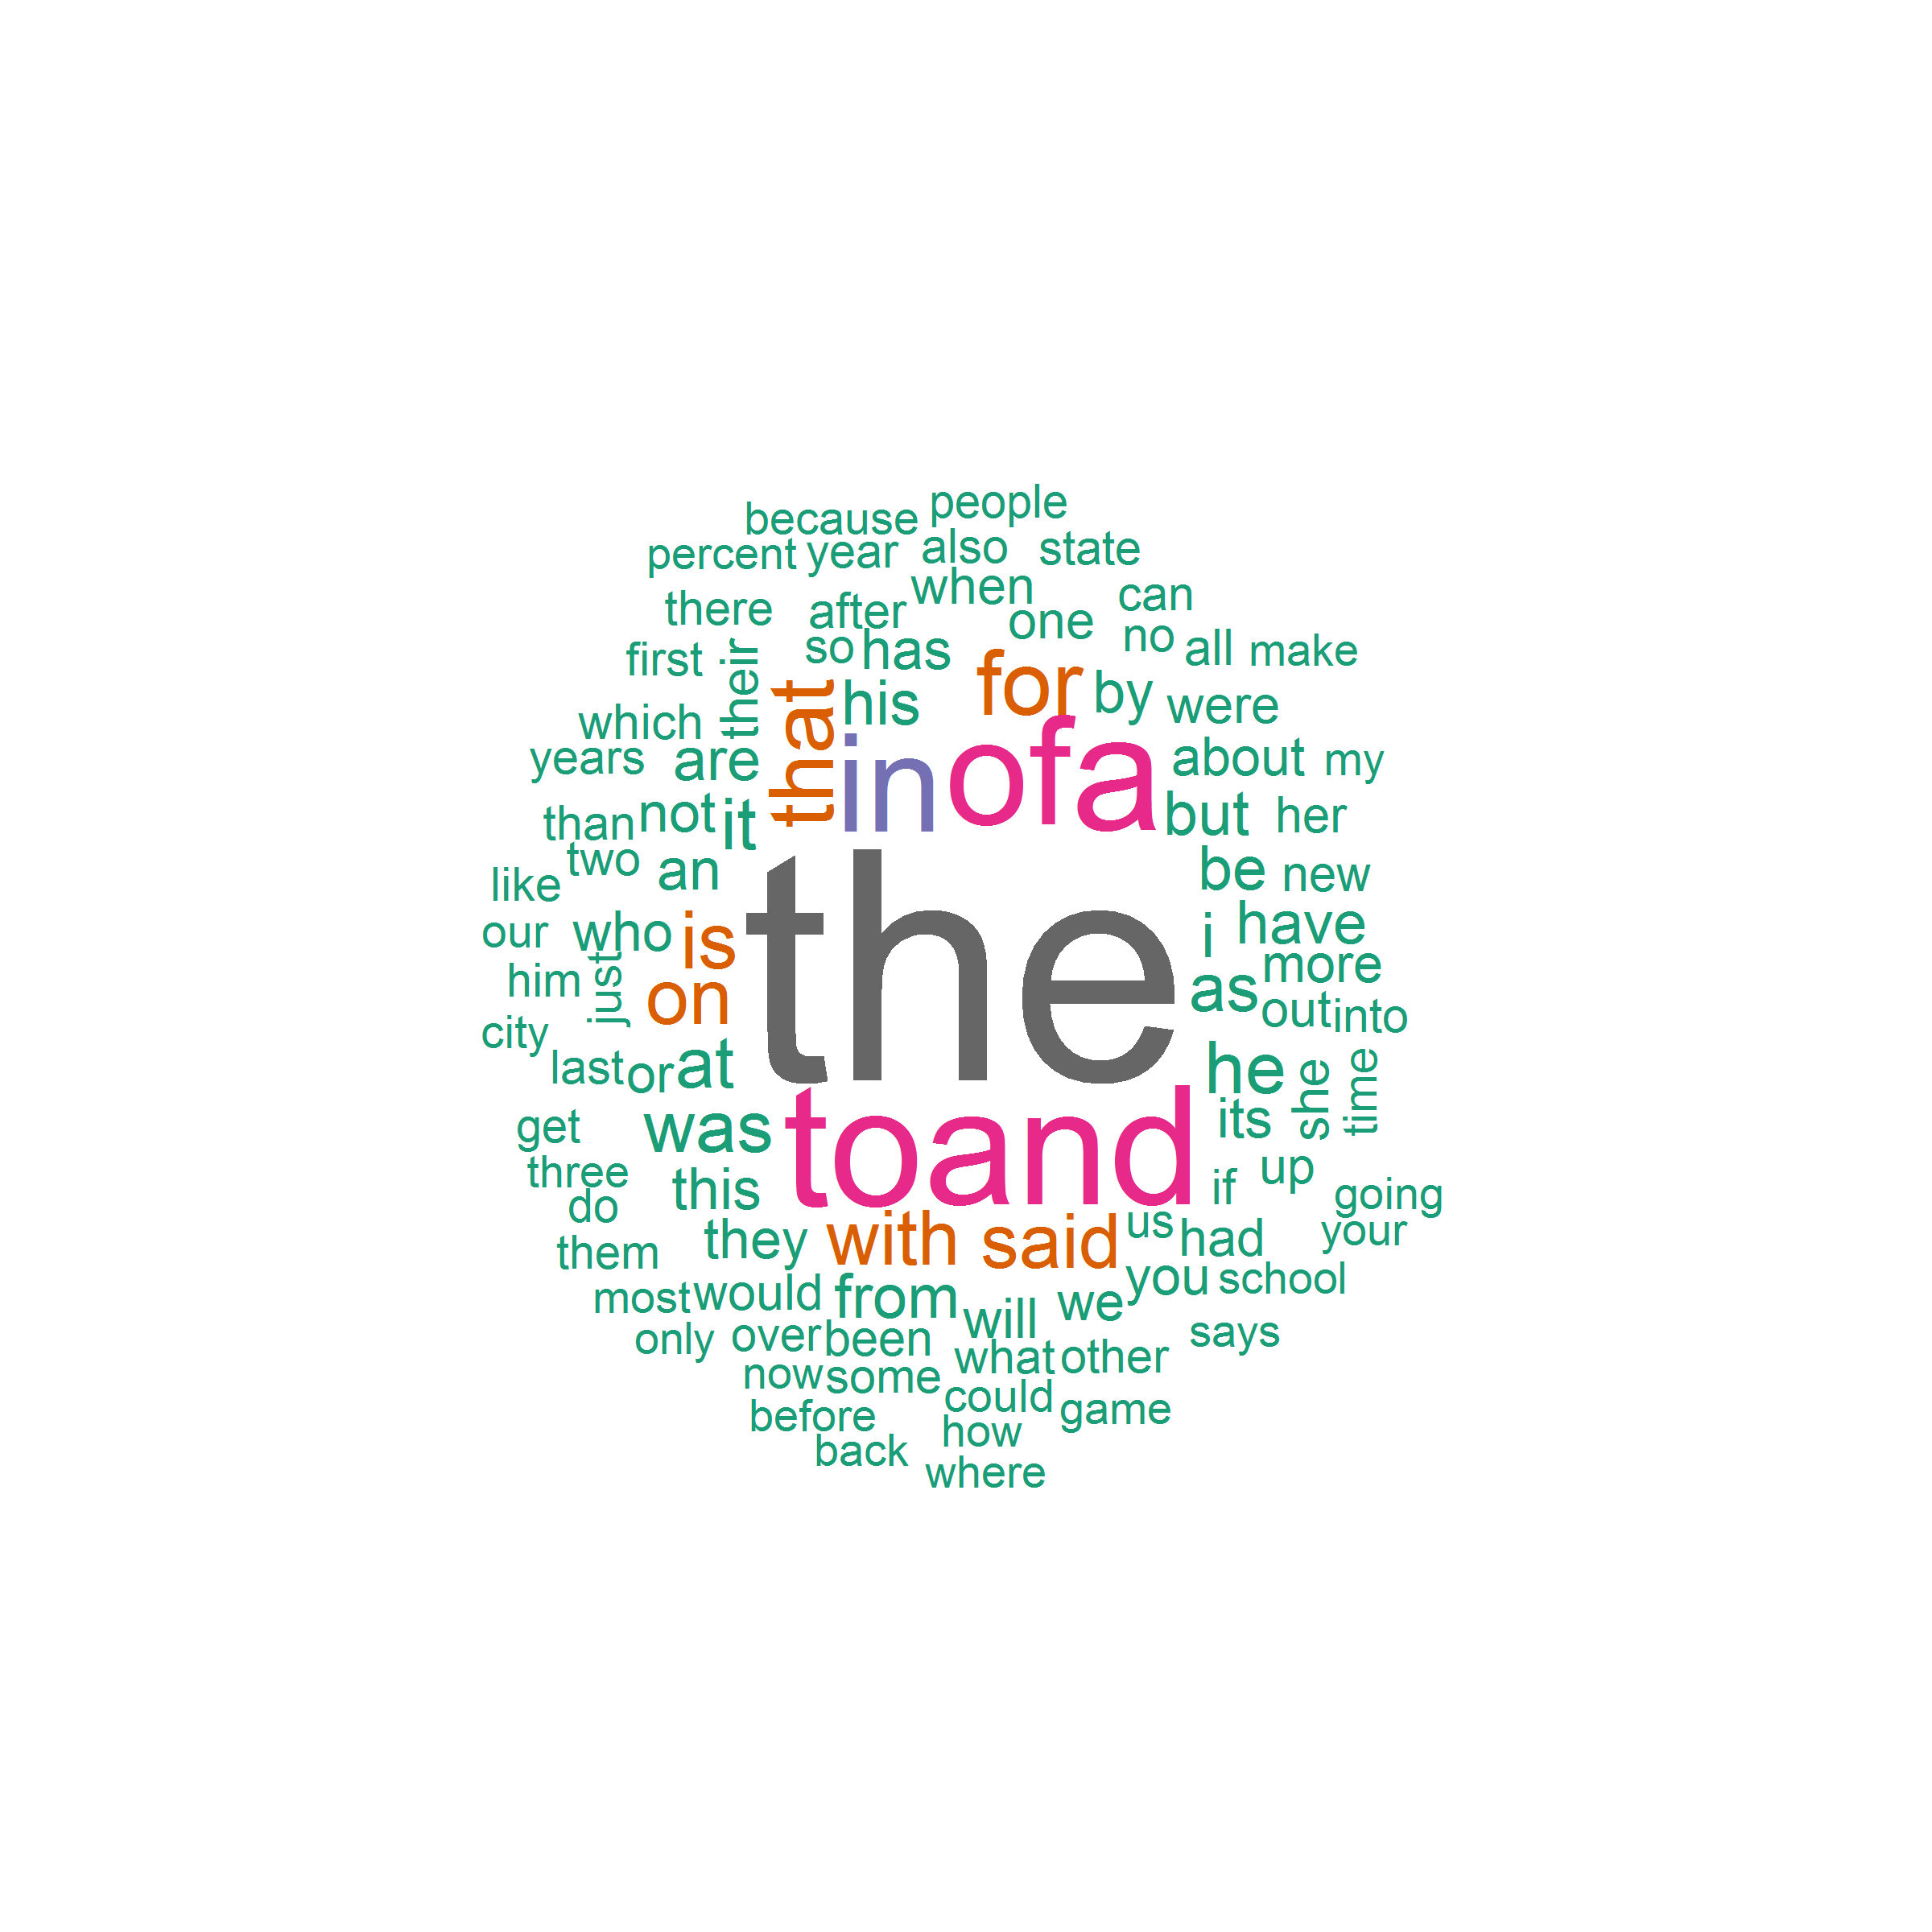
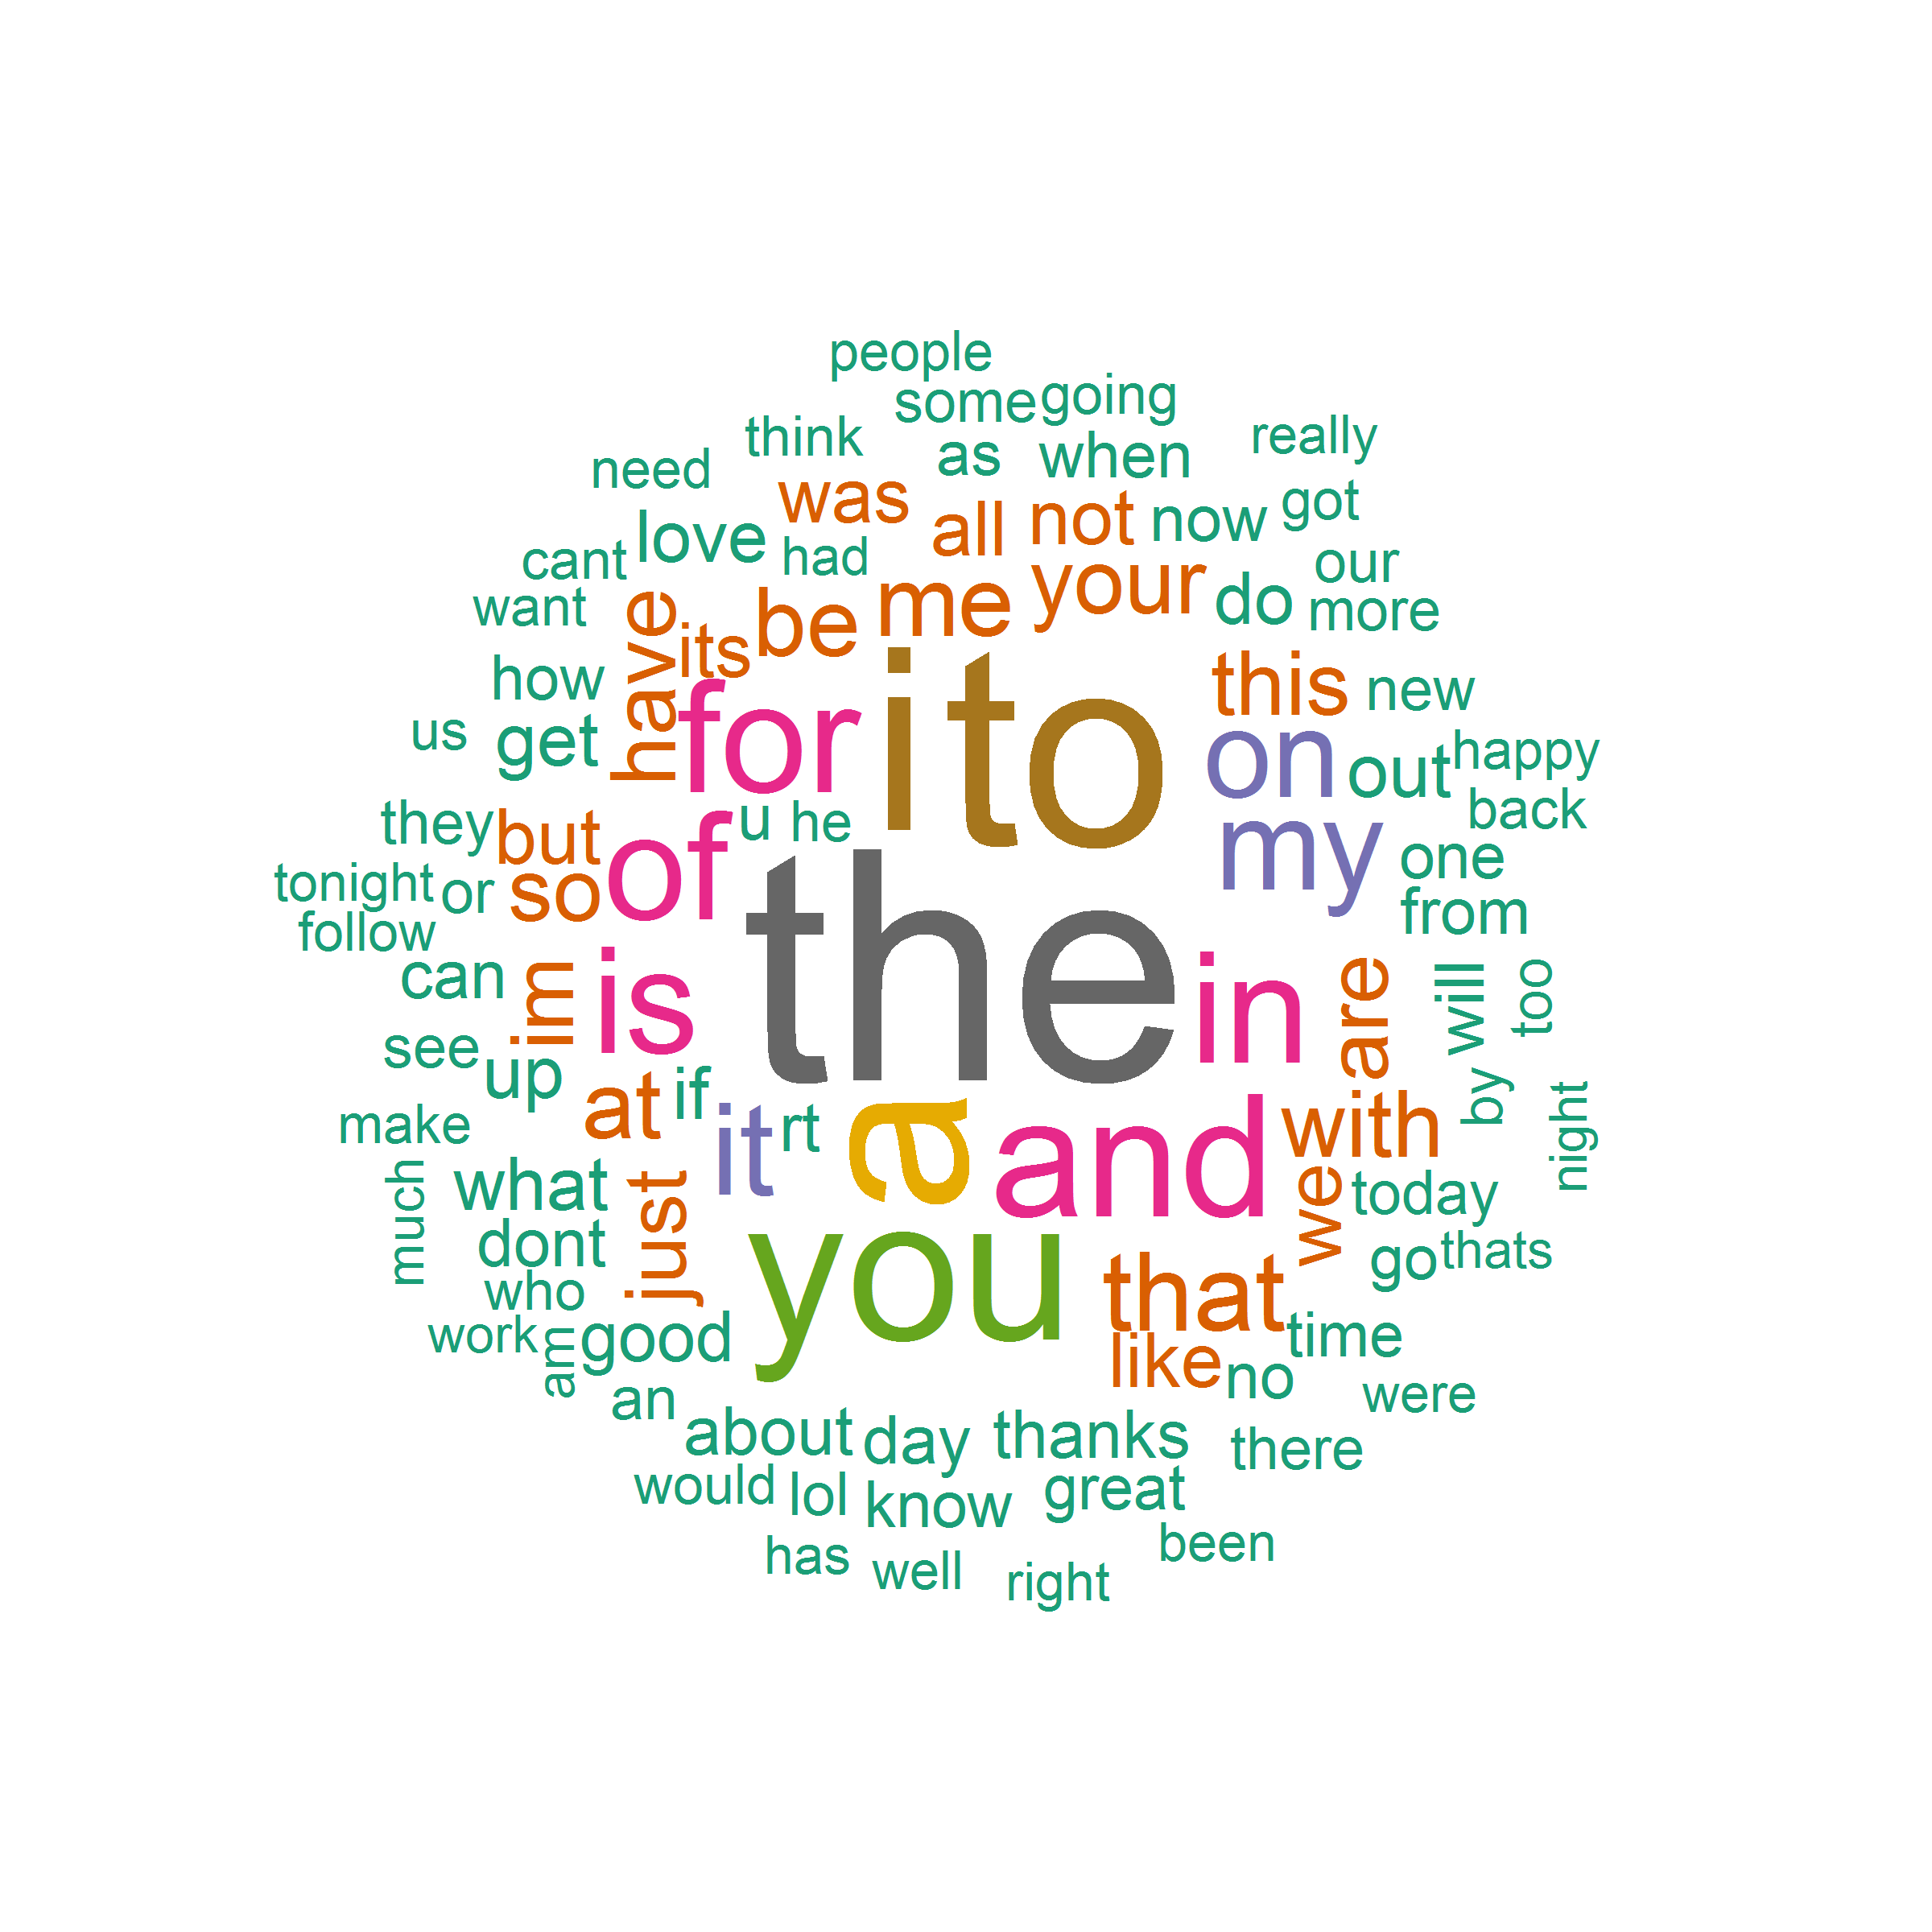
Top 100 words by frequency for the Blog, News and Twitter samples are shown in the following clouds respectively, Note: The relative size of the words indicate how often the terms occur in the document with respect to one another.
Blogs
News
Twitter
The outline for the word prediction app (which changed in places as the project progressed)
Currently an analysis of the 2,3 & 4-grams (2,3 & 4 word chunks) present in the data sets is under examination.
The initial prediction model takes the last 2,3 & 4 words from a sentence/phrase and makes presents the most frequently occurring "next" word from the sample data sets.
These frequency tables currently need to be reduced in size in order to make them feasible for an on-line shiny app where speed of prediction is a significant factor and the size of the app is a significant consideration.
In order to reduce the frequency tables, infrequent terms will be removed and stop-words such as "the, to, a" will be removed from the prediction if those words are already present in the sentence.
Profanity filtering of predictions will be included in the shiny app. A simple table of "illegal" prediction words will be used to filter the final predictions sent to the user. The app will process profanity in order to predict the next word but will not present profanity as a prediction.
Final Project [55%]
From the ruberic preamble
- A Shiny app that takes as input a phrase (multiple words) in a text box input and outputs a prediction of the next word.
- A slide deck consisting of no more than 5 slides created with R Studio Presenter pitching your algorithm and app as if you were presenting to your boss or an investor.
Note: Like the milestone report I'm not going to present a detailed breakdown of the ruberic here. I will note that the Ruberic was in 3Parts
- Please submit the URL for your text prediction Shiny app that takes as input a phrase (multiple words) in a text box input and outputs a prediction of the next word.
- Please submit a slide deck consisting of no more than 5 slides created with R Studio Presenter pitching your algorithm and app as if you were presenting to your boss or an investor. Remember to check to make sure your deck displays if you are not logged into R Pubs.
- Overall Evaluation (Two subparts: 1: Give a +1 for effort? 2: Would you hire this person for your own startup company?)
The Pitch and the Word Prediction App
The 5-slide pitch can be found: A Shiny Word Predictor Pitch
The shiny app which I submitted for the Capstone project can be found: A ShinyApp Word Predictor